
5 Best IRA Investments For Financial Independence
Introduction
As mentioned in my post about lucrative side hustle ideas for people with 9 to 5 office jobs, my journey to Financial Independence includes: Investments, Online content business (blogging), and Selling digital assets (print-on-demand products). In this post, I am going to talk about Investing. More precisely, about what I am going to put in my IRA to achieve financial independence. Since this is for IRA, my criteria are:
- Safe-ish
- But with good growth potential
- And/or steady income potential
- Passive (I don’t want to be constantly checking my phone to see how my investments are doing)
- Cheap (since I am going to let it sit, I don’t want it to be a fee guzzler)
I find that trying to be clever with investments is a waste of time. Do not get greedy trying to follow the latest fad. It will only make you barely keep up with inflation. So, keep your IRA investment strategy simple by sticking with the following ETFs:
- VOO (or SPY) – for fundamentals (this is indexed to S&P)
- SCHD (or VIG) – for modest growth but with consistent dividend yield
- QQQM (or VUG) – for growth (returns ranging 15 to 20% or more)
- JEPI (or DIVO) – income ETF (a covered call ETF yielding over 10%)
- SPGP – for achieving GARP (Growth At a Reasonable Price)
That’s it. I would put my IRA money into these 5 ETFs. Of course, I would keep some cash around (in the form of a CD – which is yielding around 5% these days) for whenever there is a black swan event and I see a sudden drop (like the one you saw back in 2020 March). When it drops like that, I am gonna need some cash to go shopping.
5 Best IRA Investments
What are the best investments for IRAs? For me, the answer is in simplicity. Just five ETFs. Yes, that’s it. You might ask “don’t you want a more diversified portfolio?” Well, it’s sort of diversified as the 5 ETFs are pretty much all of US equities.
I came to realize that I just don’t know enough about individual companies to be consistently successful at picking the right stocks. I could have fantastic success with one or two stocks, but, at the same time, I could be really hurting with some other stocks. And the net effect is that my investment returns over the long run, start to resemble the inflation rate.
My goal is to build a passive portfolio so that I don’t have to keep looking at this very day. I need to spend time building up other streams of income so, the less complicated, the better.
By the way, if you have only like a couple of years left before you are going to retire and pull out funds, then you might want to do something more conservative. ETFs like QQQ might be too volatile for the short term. On the other hand, if you are much younger and have some runway, feel free to go long on some of the more aggressive ETFs. Basically, make your own decision.
VOO – Vanguard S&P 500 ETF
This is basically an ETF that tracks the performance of S&P 500 index. This is the easiest and simplest way to put your money on S&P 500 index. But since you cannot just invest in an index (index is not a financial vehicle), people invest in funds like VOO which mirrors this index. S&P 500’s investment return is basically considered a gauge of the overall US stock market.
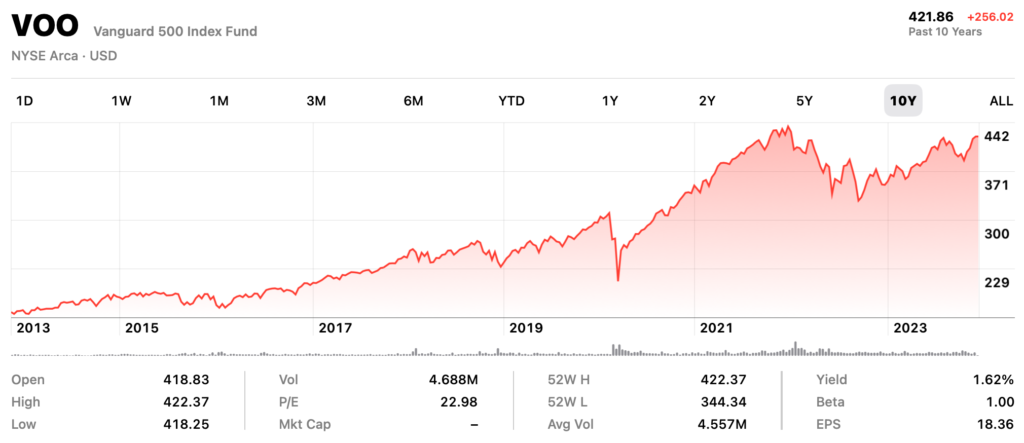
Now, there are other similar ETFs (e.g., SPY) but this one seems to be one of the cheapest and also has a big enough asset under management (AUM).
| VOO | SPY | |
| Issuer | Vanguard | State Street |
| Expense Ratio | 0.03% | 0.09% |
| Average Daily Volume | 1.75B | 32.31B |
| Assets Under Mgmt. | $353B | $434B |
| Index Tracked | S&P | S&P |
| # of Holdings | 505 | 504 |
| Last Trade | 421.86 +2.46 (0.59%) | 459.10 +2.7 (0.59%) |
The two are very similar and you cannot go wrong either way. But, if you are thinking of just letting it sit, I recommend VOO since it is cheaper.
I should also mention that there is another great ETF run by Vanguard, VTI. It is basically the entire US stock market. And it looks almost identical to VOO but, its price tag is lower than that of VOO. For example, VTI is priced at 236.96 (as of Dec 30) while VOO is priced at 435.98. So, if lower price tag matters to you, then VTI would be just as good.
SCHD – Schwab US Dividend Equity ETF
This one is for maximizing dividend earnings. It is designed to measure the performance of high dividend yielding stocks issued by U.S. companies that have a record of consistently paying dividends.

| SCHD | VIG | |
| Issuer | Charles Schwab | Vanguard |
| Expense Ratio | 0.06% | 0.06% |
| Dividend Yield | 3.58% | 1.91% |
| Assets Under Mgmt. | 48B | 70B |
| Index Tracked | DJ US Dividend 100 Index | S&P U.S. Dividend Growers Index |
| # of Holdings | 102 | 316 |
| Last Trade | 73.15 +0.8 (1.11%) | 165 +1.23 (0.75%) |
Since VIG tends to do better against bear market environments, if you are looking at shorter term performance VIG might be a better option. In summary, both SCHD and VIG are solid dividend ETFs and you really can’t go wrong with either of them. However, the dividend yield for SCHD is superior to that of VIG. So, I am going to go with SCHD.
QQQ – Invesco QQQ Trust ETF
This ETF tracks the NASDAQ-100 Index. Basically, it focuses on growth stocks and is an excellent choice for investors looking to invest in a variety of growth stocks. The NASDAQ-100 holds the 100 largest non-financial stocks listed on the NASDAQ. This is one of the indexes where legendary names such as Apple Inc. (AAPL), Microsoft Corporation (MSFT) and Amazon.com, Inc. (AMZN) resides. However, just note that the expense ratio is higher than that of SCHD or VOO at 0.20%.
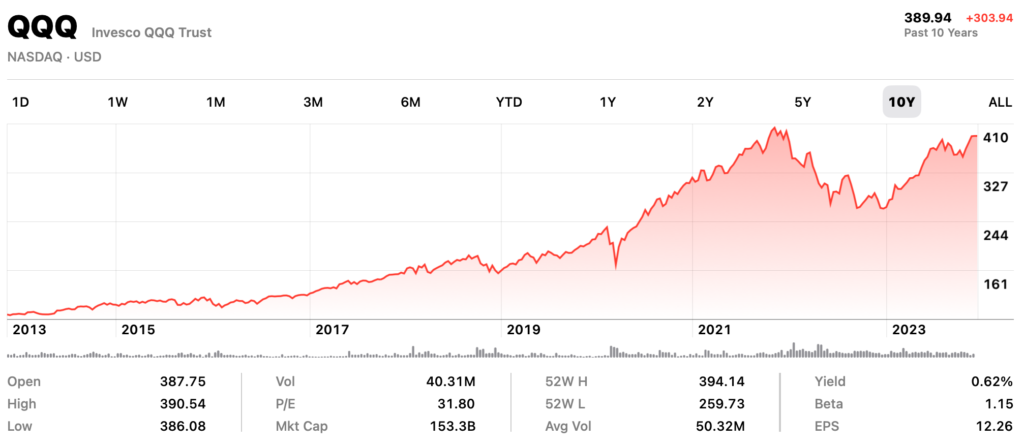
Downside: may result in higher volatility and the fund’s dividend yield is relatively low, so it may not be the best choice if you are seeking consistent income. I compared QQQ against a similar growth ETF like VUG.
| VUG | QQQ | |
| Issuer | Vanguard | Invesco |
| Expense Ratio | 0.04% | 0.15% |
| Assets Under Mgmt. | 99B | 221B |
| Index Tracked | CRSP US Large Growth Index | NASDAQ 100 Index |
| # of Holdings | 223 | 102 |
| YTD Performance | 40.75% | 46.66% |
When comparing performance, QQQ has a stronger performance (for example, YTD of 46% vs. 40% for VUG). However, QQQ has a higher expense ratio and bigger volatility levels, particularly during market downturns.
Similar to VOO and VTI mentioned above, there is a cheaper priced ETF alternative for QQQ, called QQQM. This is basically identical to QQQ but, comes with a price tag of around 167 instead of QQQ’s 407 (as of Dec 30th). So, if lower price tag is important to you (it is for me since I will be going minuscule DCA), QQQM may be better.
There is a simple way to calculate expense ratio. Whenever they say the expense ratio is 0.20% or 0.05%, you just need to remove 4 zeros from the amount you are investing and then multiply by the expense ratio without the decimal points. For example, if the expense ratio was 0.20%, then for every 10,000 you invest in that ETF, they will charge you 20 dollars.
- 10,000 (principle) –> 1,
- 0.20% (expense ratio) –> 20,
- 1 (principle) x 20 (expense ratio) = 20.
The formula is 10,000 x 0.20% = 20 dollars. So, if you were to put in 5,000, then your expense would be 10 dollars
JEPI – JPMorgan Equity Premium Income ETF
According to ETF.com’s Why JEPI Is Attractive to Nervous Investors, “JEPI is an actively managed exchange-traded fund that seeks to provide similar returns as the S&P 500 index, with lower volatility plus monthly income. To achieve this dual objective, JEPI holds value stocks with favorable risk/return characteristics and owns equity-linked notes (ELNs) structured to use as a covered call strategy. As a covered call ETF, JEPI can use a covered call writing strategy on a portion of its portfolio to generate additional income for investors while still providing exposure to the underlying stocks in the portfolio.”
Ok. I understood… none of that. 😶
Anyway, what’s important is that this ETF offers high yields with low volatility. You get high income dividend without much of the down side risk. Investors are interested in JEPI because:
- High yields – delivers 5 to 8% yield over time (has provided much higher yields in the last few years)
- Low volatility – it claims 35% lower volatility compared to the S&P 500 index
- Active management – rather than leaving it to chance, this ETF has someone who is actively looking at it and managing it
But, there are also some Cons to JEPI:
- Complex – well, you saw that explanation in the beginning, right? It’s hard to understand exactly how this ETF works; looks like it thrives on volatility; so when the market is calm, this ETF doesn’t do well
- Short track record – its been around for only like 3 years
- Upside appreciation seems limited – because it uses covered call strategy, its performance can (and likely will) lag behind that of S&P in the long run
So, in a nut shell, this can be a good investment for risk-averse investors looking for low volatility with good yields. However, because of the limited upside potential, I will not keep this for a very long time. I will review this one in a few months and replace it (with a high-yielding REIT or something) if it doesn’t deliver.
Because JEPI offers dividend income, I decided to compare against SCHD which we already saw earlier.
| JEPI | SCHD | |
| Issuer | JPMorgan Chase | Charles Schwab |
| Expense Ratio | 0.35% | 0.06% |
| AUM | 30B | 48B |
| Index Tracked | No underlying index | DJ US Dividend 100 Index |
| Dividend Yield | Unpredictable yield 12% in 2022… less in 2023. Aim is to achieve 6% to 10% | 3.5% |
Comparing the two, two things are noticeable right away. Expense ratio and dividend yield. While the expense ratio forJEPI is higher than that of SCHD, the dividend yield is also quite high.
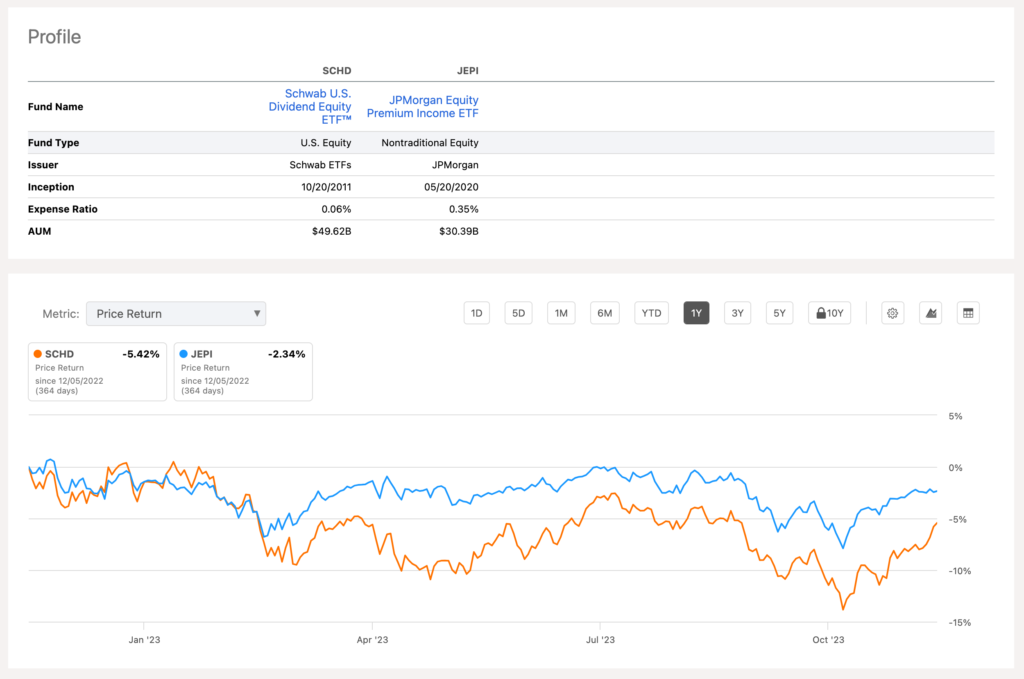
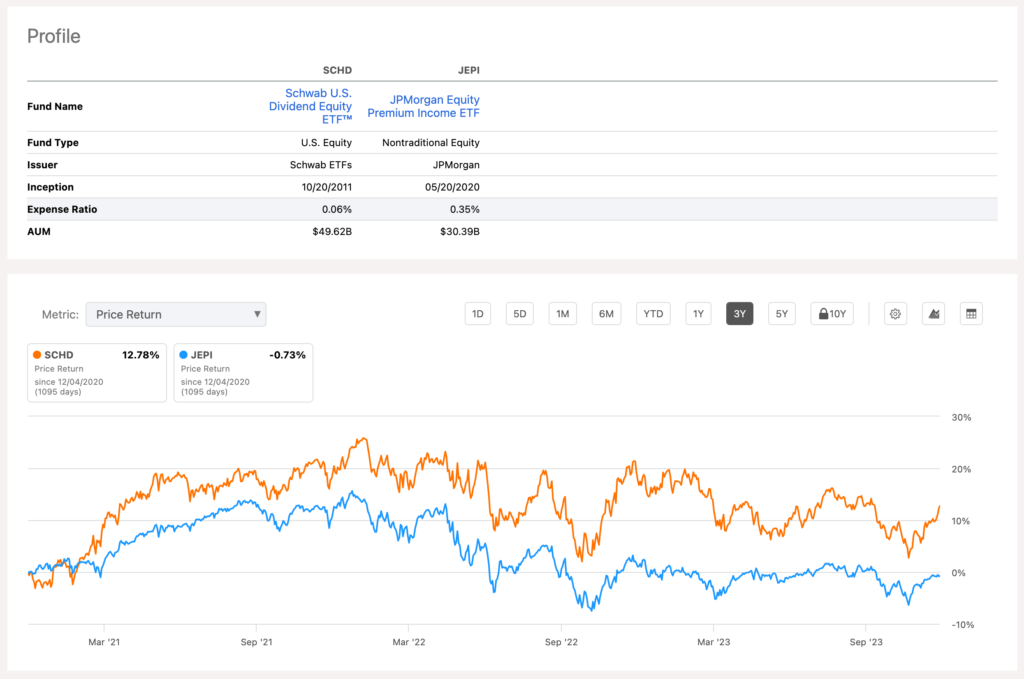
I put up two charts. One for 1 year timeframe and the other is for 3 years. Notice how they completely switch places. When looking at just the past year, JEPI pulled ahead of SCHD. However, when we extend the timeline to 3 years, SCHD looks much better with 12% growth vs JEPI’s -0.73%.
SPGP – INVESCO S&P 500 GARP ETF
The investment seeks to track the investment results (before fees and expenses) of the S&P 500® GARP Index. It is a passively managed ETF with a very different holdings than VOO.
| SPGP | VOO | |
| Issuer | Invesco | Vanguard |
| Expense Ratio | 0.36% | 0.03% |
| AUM | 3.99B | 353B |
| No of Holdings | 76 | 505 |
| 1 Year Growth | 7.50% | 13.86% |
| 3 Year Growth | 12.38% | 9.71% |
SPGP’s holdings are very different from those held by VOO. For example, it holds a lot more of energy companies whereas VOO holds a lot of tech companies. As such, it will provide some additional diversification to your portfolio.

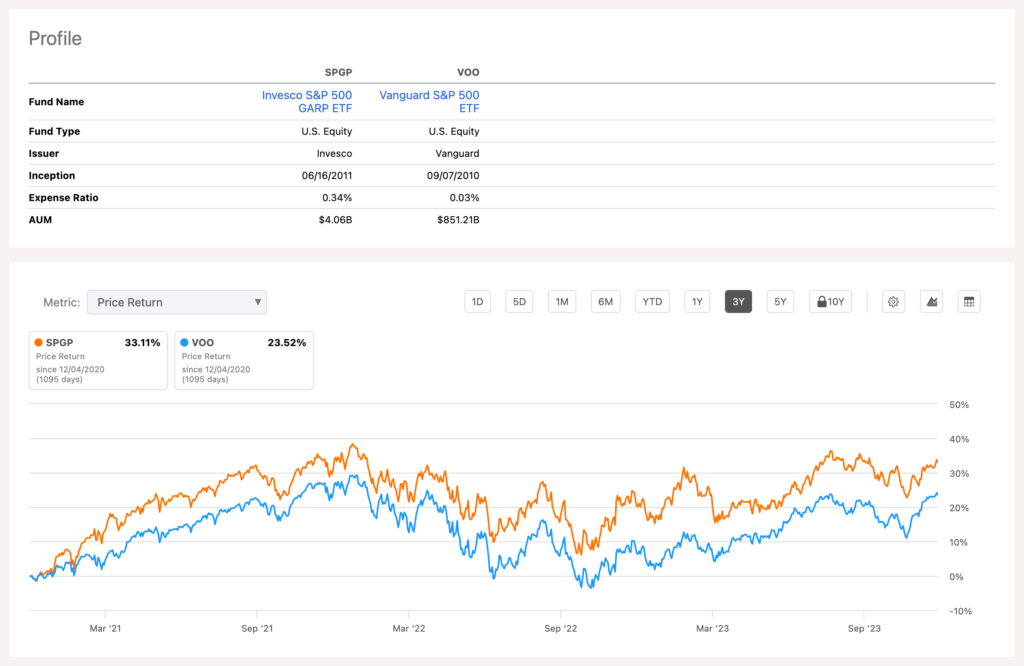
Similar to JEPI, SPGP’s performance is better in the longer horizon than shorter one. When just looking at 2023 performance, VOO is much better. However, when you extend that to 3 year or 5 years, SPGP excels ahead.
These last two ETFs were sort of diversification ETFs, serving as an addition to the primary VOO, SCHD, and QQQ ETFs. JEPI is quite young so, out of all of them JEPI is the one I am most concerned about and will likely change to a REIT if I don’t see it perform in the next couple of quarters.
Distribution
I try to keep it simple and distribute evenly across the 5 ETFs. Again, do not get clever with this. And do not get greedy. Just be disciplined. I put 20% into VOO, 20% into QQQ, 20% into SCHD, and so on. Now, separate from this, I also keep cash on the side (mostly in the form of CDs or high-yield savings). It is a reserve for going shopping when there’s a black swan event and the entire market drops like 30, 40%. More on this below.
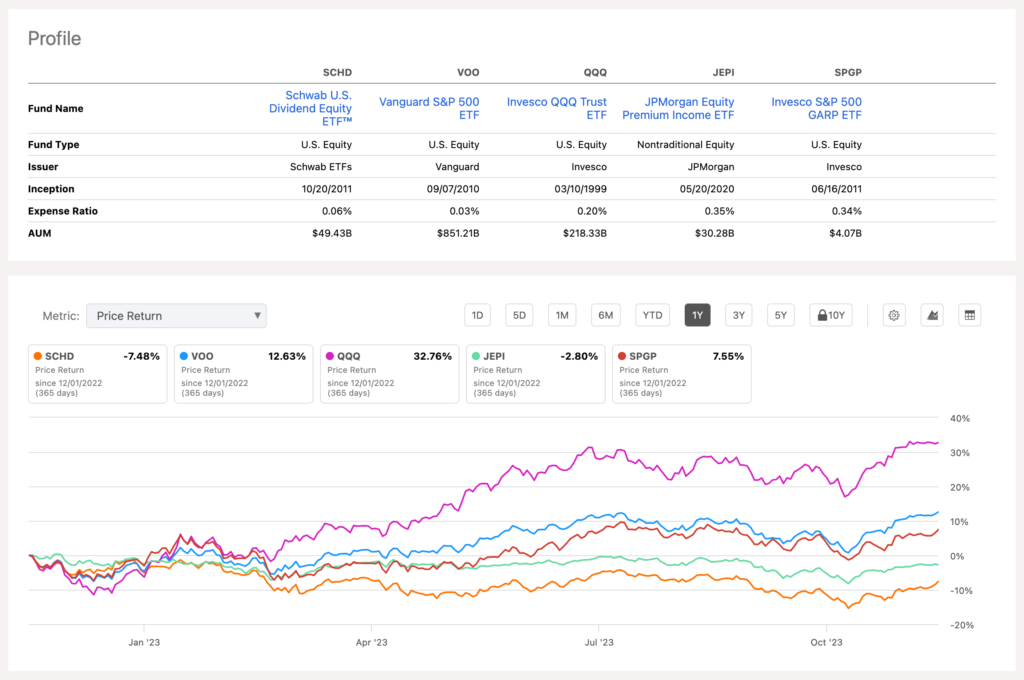
I threw in the comparison chart to help with the visual – comparing the 5 ETFs: SCHD, VOO, QQQ, JEPI, and SPGP. As you can see on the graph, over the 1 year, VOO is generating around 12%+ investment return. QQQ is doing super with its 32% return in just one year. JEPI, while delivering over 12% dividend, its growth is negative 2.8%. SCHD’s growth is the worst with -7.48%.
But, since our time horizon is not just 1 year, let’s see how they compare when we extend to 3 years. Surprisingly, we see SPGP beating them all and coming in the first place with a 36% growth, followed by QQQ at 28%. Then we see VOO with its 25% and SCHD at 14.9%. The only ETF down in the negatives is JEPI -1.03%. But, need to remember that JEPI delivers around 10% in dividend income so, a slight negative is acceptable.
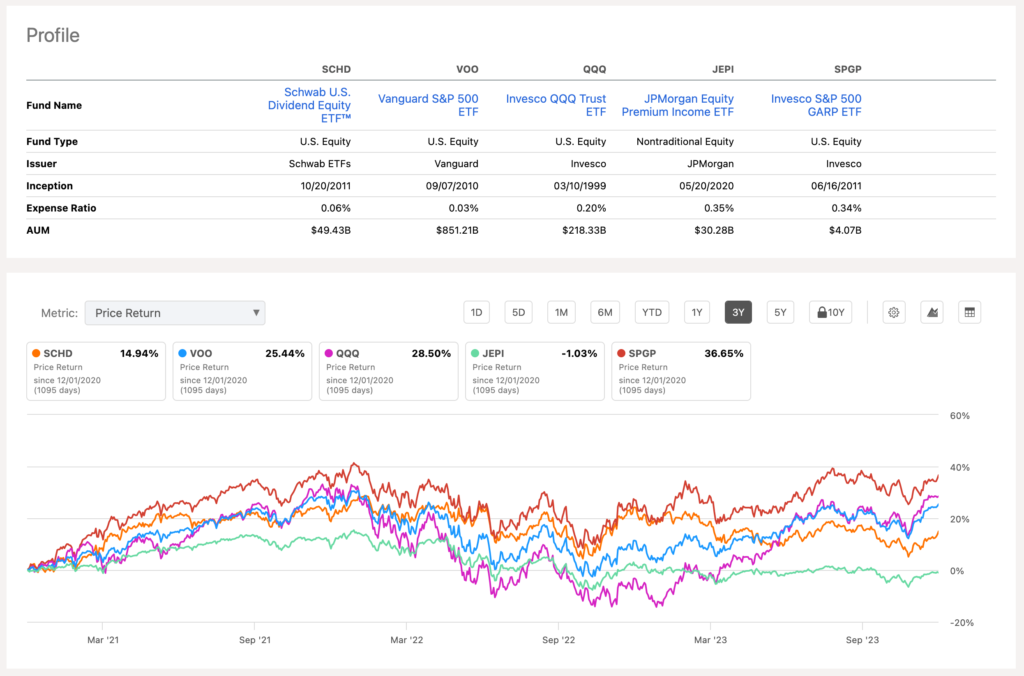
Now, you might say, why don’t I just throw like 50% of my money into QQQ? Well, that’s certainly tempting but, I think it’s important to remember that past performance is not an indication of future performance. Future may bring something new to the market dynamics that could render QQQ to go through a much worse return than the last three years. So, just keep it simple and distribute equally, dollar cost average, systematically.
When There Is A Black Swan Event…
Now, when there is a 30, 40% drop, I plan on putting whatever side cash I have into SPGP and QQQ. So, over time, as we go through black swan events, SPGP and QQQ will have more weight distribution compared to others.
Now, I must admit, I also looked at leveraged ETFs like TQQQ. I am still on the fence about these. They can be tempting especially when there is a black swan event and the market is down by 30, 40%. Because you would think that that might be the bottom and things can only go up. The only thing is that you don’t know where the bottom is. And these leveraged ETFs amplify your wins as well as your losses. So, if I have some extra cash that I don’t mind not seeing again, maybe I will consider. But, again, this goes back to the act of trying to time the market.
Definitely do not put your son’s college tuition savings in there.
Leveraged ETFs can be riskier investments than non-leveraged ETFs given that they respond to daily movements in the underlying securities that they represent, and losses can be amplified during adverse price moves. Furthermore, leveraged ETFs are designed to achieve their multiplier on one-day returns, but you should not expect that they will do so on longer-term returns. For example, a 3× ETF may return 3% on a day when its benchmark rises 1%, but you shouldn’t expect it to return 30% in a year when its benchmark rises 10%.
Conclusion
So, in conclusion, IRA account is an important component of my overall financial independence journey. My focus is on creating a simple passive growth system that I can easily maintain without effort. In this regard, I pick just 5 ETFs (VOO, SCHD, QQQ, JEPI, and SPGP) and I Dollar Cost Average (DCA) into them (20% each) periodically and methodically. If it’s too complicated, if I have too many things to juggle, then I get distracted and overwhelmed to the point where I end up doing nothing.
So, just keep it simple, keep putting small amounts regardless of the market conditions and don’t. ever. get. emotional.
In my next posts, I will go into the different types of IRA accounts and how I plan to minimize tax expense – which could be a big expense when you start taking out your funds in the future.
Ok, See you.
The comments, opinions, analyses and views expressed on this website are personal (recordings of what I am personally doing or going to do) and do not belong to any corporation, organization, committee, or other group or individual. I do not provide financial advice. This is for educational and/or entertainment purposes only and should not be considered as investment advice or recommendations to invest in any security or adopt any investment strategy.
Questions?
Here are some of the most frequently asked questions.